
A single piercing whistle or continuous tone can completely ruin an otherwise clear audio recording. Whether it is an acoustic feedback loop on a live stage, electromagnetic interference from a switched-mode power supply, or a continuous reference tone accidentally coupled into a transmission line, tonal interference stands out sharply because human ears are remarkably sensitive to periodic acoustic energy.
Unlike broadband noise like tape hiss, wind gusts, or ambient background rumble—which contains energy across a broad range of frequencies—a tonal whistle is narrowband. In the frequency domain, it manifests as a razor-sharp, solitary spike rising high above the surrounding speech or musical harmonics.
Because the interference is concentrated at a specific frequency, you do not need to muffle your entire audio track with a heavy lowpass filter. Instead, the canonical signal processing tool for this task is the digital notch filter (or band-reject filter).
In this interactive tutorial, we will explore how a notch filter works, examine the role of center frequency (f₀) and quality factor (Q), and walk through a hands-on experiment directly in your web browser using CircuPilot Signal Lab—complete with real audio synthesis, live A/B listening comparison, and real-time FFT spectrum analysis.
🎛️ Try the Live Notch Filter Experiment
You can open and run this exact audio DSP setup in your browser right now with zero installation:
What Is a Digital Notch Filter?
A notch filter is a specialized bandstop filter engineered to provide extreme attenuation over a very narrow slice of frequencies, while passing all other frequencies with virtually zero gain change (unity gain, 0 dB).
Mathematically, a classic second-order Infinite Impulse Response (IIR) digital notch filter places a pair of complex-conjugate zeros directly on the unit circle of the complex Z-plane at angle ω₀ = 2π(f₀ / fs). Because |z| = 1 at the unit circle, the frequency response plunges to theoretical zero at exactly f₀. To keep the notch localized and prevent it from scooping out neighboring frequencies, a matching pair of poles is placed just inside the unit circle along the same radial line at radius r < 1.
Two primary parameters govern every notch filter:
- Center Frequency (f₀): The exact frequency target you wish to eliminate (for instance, 1000 Hz for a high-pitched test tone, or 50 Hz / 60 Hz for AC powerline hum).
- Quality Factor (Q): The selectivity or sharpness of the notch. The -3 dB rejection bandwidth (Δf) is inversely proportional to Q, governed by the formula: Δf = f₀ / Q. A higher Q factor produces a narrower notch that surgically carves out the offending tone without disturbing adjacent acoustic content. Conversely, a lower Q factor broadens the notch, affecting neighboring musical notes or speech formants.
The Experiment: Removing a 1 kHz Whistle Step-by-Step
To bridge mathematical theory with audible reality, we set up an interactive laboratory workflow in CircuPilot Signal Lab running at a 16 kHz sampling rate commonly used for wideband speech processing over a 2.0-second buffer (32,000 discrete samples).
Step 1: Open the Pre-Built Lab 6 Template
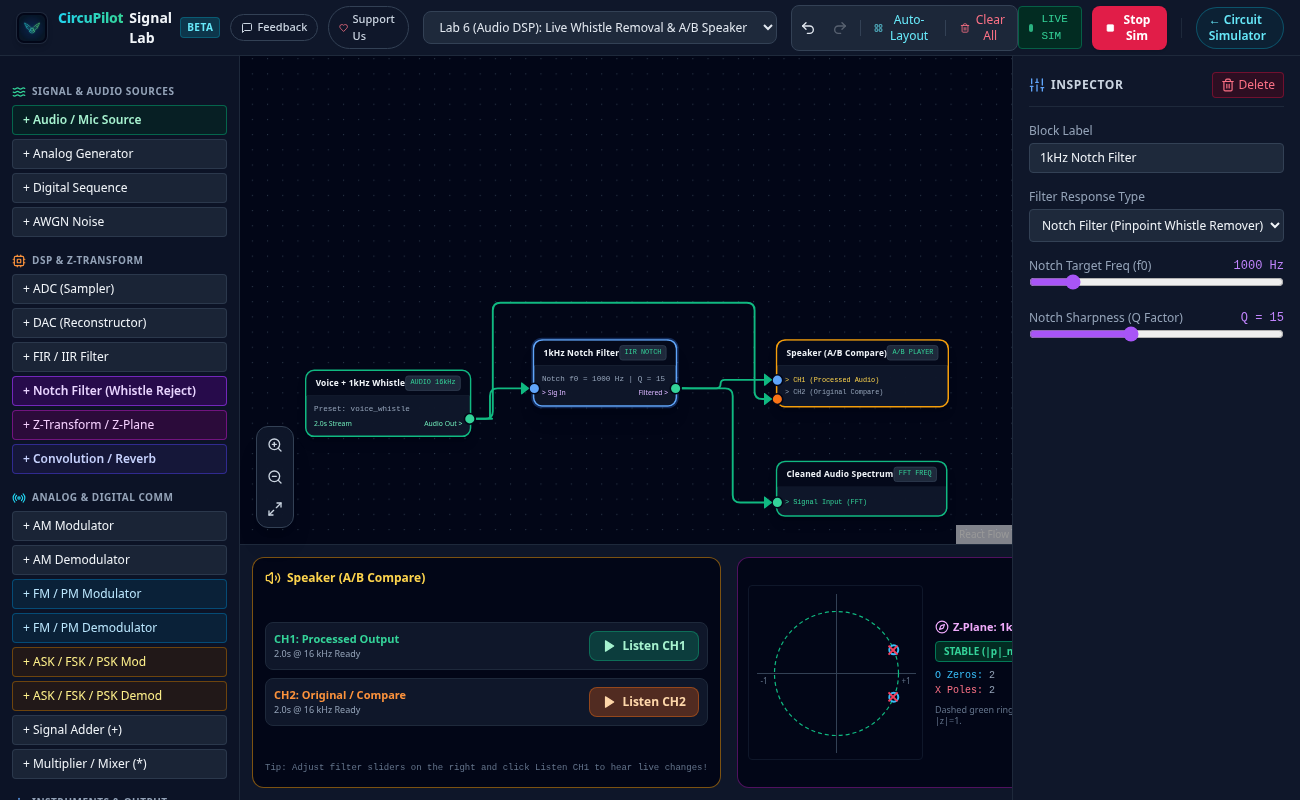
Navigate to CircuPilot Signal Lab in any modern desktop or mobile browser. If the canvas is blank, click the quick-start button 6. Audio DSP & Speaker (Whistle Notch) on the welcome card, or select Lab 6 (Audio DSP): Live Whistle Removal & A/B Speaker from the top template dropdown.
The workspace automatically arranges four interconnected blocks:
1. Audio Source (Voice + 1kHz Whistle): A human speech sample contaminated by an additive 1000 Hz continuous sinusoidal tone.
2. IIR Notch Filter (1kHz Notch Filter): An IIR filter initialized with f₀ = 1000 Hz and Q = 15.
3. Dual-Channel Audio Speaker (Speaker (A/B Compare)): An output player dock receiving the filtered output on CH1 and the raw reference on CH2.
4. Spectrum Analyzer (Cleaned Audio Spectrum): An FFT frequency analyzer plotting the magnitude response in decibels (dB).
Step 2: Listen to the Difference (CH1 vs CH2)
Click the Run button in the top toolbar to simulate the signal flow. Look at the Audio Speaker dock at the bottom of the screen:
- Click Listen CH2 (Original / Compare): You will clearly hear speech, but your ears will immediately cringe at the sharp, piercing 1 kHz whistle buzzing relentlessly over the voice.
- Now click Listen CH1 (Processed Output): The piercing 1 kHz tone is substantially attenuated, allowing the spoken words to come through clearly with the intrusive whistle largely suppressed.
By toggling between CH1 and CH2 in real time, you can perform an objective A/B listening comparison without needing audio editing software or digital audio workstations (DAWs).
Step 3: Inspect the Frequency Spectrum (FFT)
Listening provides intuitive confirmation, but examining the FFT spectrum provides quantitative engineering proof:
1. In the bottom dock, inspect the Cleaned Audio Spectrum plot.
2. Note the horizontal frequency axis extending up to the Nyquist limit (8 kHz).
3. Look at the 1000 Hz mark: in our test simulation, the spectrum analyzer shows the 1 kHz peak dropping from approximately -25 dB in the raw signal down to -66 dB after filtering—a substantial measured attenuation of roughly 40 dB—while the speech spectrum on both sides (200 Hz – 800 Hz and 1200 Hz – 4000 Hz) remains largely intact.
How Does the Quality Factor (Q) Affect Audio?
Click on the 1kHz Notch Filter block on the canvas to open its parameters in the right-hand Inspector panel. Locate the Notch Sharpness (Q Factor) slider and experiment with different values:
Case A: Low Q Factor (Q = 2 to 4)
With Q = 3, the -3 dB bandwidth expands to Δf = 1000 / 3 ≈ 333 Hz. The filter now attenuates everything from roughly 850 Hz to 1180 Hz. When you click Listen CH1, the whistle is heavily suppressed, but the voice can sound noticeably thinner or hollowed out, as wanted speech harmonics in that range are also attenuated.
Case B: High Q Factor (Q = 15 to 30)
Slide Q up to 20. Now the -3 dB rejection bandwidth narrows to Δf = 1000 / 20 = 50 Hz (covering only 975 Hz – 1025 Hz). By concentrating the attenuation into this narrower band, speech clarity is better preserved with fewer audible phase artifacts, while the unwanted tone remains strongly suppressed.
Engineering Takeaway: In practical audio mastering and telecommunications, you want the highest Q factor that reliably encompasses the interference bandwidth. However, if the interfering tone wanders slightly due to temperature or oscillator drift, an excessively high Q might miss the drifting peak.
Try It with Your Own Voice or Uploaded Audio
The experiment is not limited to synthetic tones:
1. Select the Audio Source block on the canvas.
2. In the right Inspector panel, click Record Microphone (2.2s). Speak into your microphone while whistling or humming a sustained tone.
3. Once recorded, inspect the FFT spectrum to identify the peak frequency of your hum.
4. Click the Notch Filter block, adjust Notch Target Freq (f0) to match your measured frequency, and click Listen CH1 to hear your custom notch filter in action!
5. You can also click Upload Audio File (WAV/MP3) to test real recordings, guitar tracks, or podcast audio.
Where Are Notch Filters Used in the Real World?
Notch filtering is a staple across electrical engineering and acoustics:
- 50 Hz / 60 Hz Mains Hum Elimination: Sensitive analog sensors, guitar pickups, and medical instrumentation (such as electrocardiograms, or ECGs) frequently pick up inductive electromagnetic radiation from AC power lines. A high-Q 50 Hz or 60 Hz notch filter cleans the signal before digital processing.
- PA System Feedback Suppression: Live sound engineers use automated notch filters to detect howling microphone feedback frequencies and insert narrow notches before the speakers squeal uncontrollably.
- Biomedical Instrumentation: EEG and EMG recordings operate at microvolt levels where powerline interference can completely swamp biological neural signals without surgical notch filtering.
What a Notch Filter Cannot Do
While a notch filter is the ideal solution for localized tonal interference, it is important to recognize its operational boundaries:
- It cannot remove broadband white or pink noise: Broadband noise spans all frequencies simultaneously. Applying a notch filter will merely create a tiny hole in the noise spectrum without noticeably lowering the perceived hiss.
- It cannot cancel reverberation or room echo: Reflections arrive across wide time delays and multiple frequencies, which requires deconvolution or adaptive acoustic echo cancellation (AEC), not a static notch.
- It removes desired signal content at that exact frequency: If a soprano singer hits a sustained high C6 (1046 Hz), a 1 kHz notch filter will attenuate part of that musical note.
Conclusion
Understanding digital filters becomes intuitive when you can simultaneously hear the audio, inspect the time-domain waveform, and observe the frequency spectrum response. A second-order IIR notch filter demonstrates how digital signal processing solves real-world audio challenges through targeted mathematical design.
Ready to explore interactive digital signal processing? Open CircuPilot Signal Lab to experiment with notch filters, FIR/IIR Butterworth filters, complex Z-plane unit-circle stability plots, and analog/digital modulation systems—directly in your browser with zero installation.
📡 Start Experimenting in Your Browser
CircuPilot Signal Lab is free and open to everyone with zero installation and no login required. Load pre-built templates for audio notch filtering, Nyquist sampling, AM/FM modulation, and Z-plane stability analysis:
Frequently asked questions
What is a notch filter used for in audio?
A notch filter (or band-reject filter) is used to surgically attenuate a specific, stable unwanted tone—such as a 1 kHz test whistle, 50 Hz/60 Hz mains hum, or stationary feedback spikes—while largely preserving surrounding speech or music. It is designed for localized narrowband interference, though it cannot eliminate dynamic or wideband acoustic feedback.
How do you calculate the bandwidth of a notch filter?
The nominal -3 dB rejection bandwidth (Δf) is governed by the formula Δf = f0 / Q, where f0 is the center notch frequency in Hz and Q is the quality factor. For a notch centered at 1000 Hz with Q = 20, the nominal -3 dB bandwidth is approximately 50 Hz, corresponding to frequencies around 975–1025 Hz. The actual attenuation across that band depends on the filter design rather than abrupt cutoff.
What happens if the Q factor of a notch filter is too low?
A lower Q factor (such as Q = 2 or 3) creates a significantly wider notch, which may attenuate wanted speech harmonics or nearby musical components. Depending on the input signal, this can make the audio sound noticeably thinner, hollow, or less natural.
Can a notch filter remove background hiss or room echo?
No. A notch filter is designed specifically for narrowband tonal interference concentrated at a single frequency. Broadband noise (like tape hiss or wind) spans across the audible spectrum, and room reverberation involves complex multi-path reflections, which require specialized broadband denoising or room dereverberation algorithms rather than a static notch.
How can I test a digital notch filter online without installing software?
You can use CircuPilot Signal Lab (lab.circupilot.com) directly in your web browser. It features an interactive audio DSP workstation (Lab 6) with synthesized speech, live browser microphone recording, WAV/MP3 upload, an interactive IIR notch filter, FFT spectrum analyzer, and dual-channel A/B speaker listening.